Antarctic scientists have combined measurements provided by an underwater robot with existing satellite data to show that Antarctic sea ice may be thicker than previously thought. Their first-of-a-kind high-resolution 3D maps cover over 500,000 square meters (5.4 million sq ft) in the Weddell, Bellingshausen, and Wilkes Land sectors of Antarctica, and they reveal heavy deformation in all three near-coastal regions that produces mean sea-ice draft (thickness of the submerged part of the ice) far in excess of ice drilling and ship-based measurements. This is a big leap forward in our ability to understand why and how the ice is changing on both small and large scales.
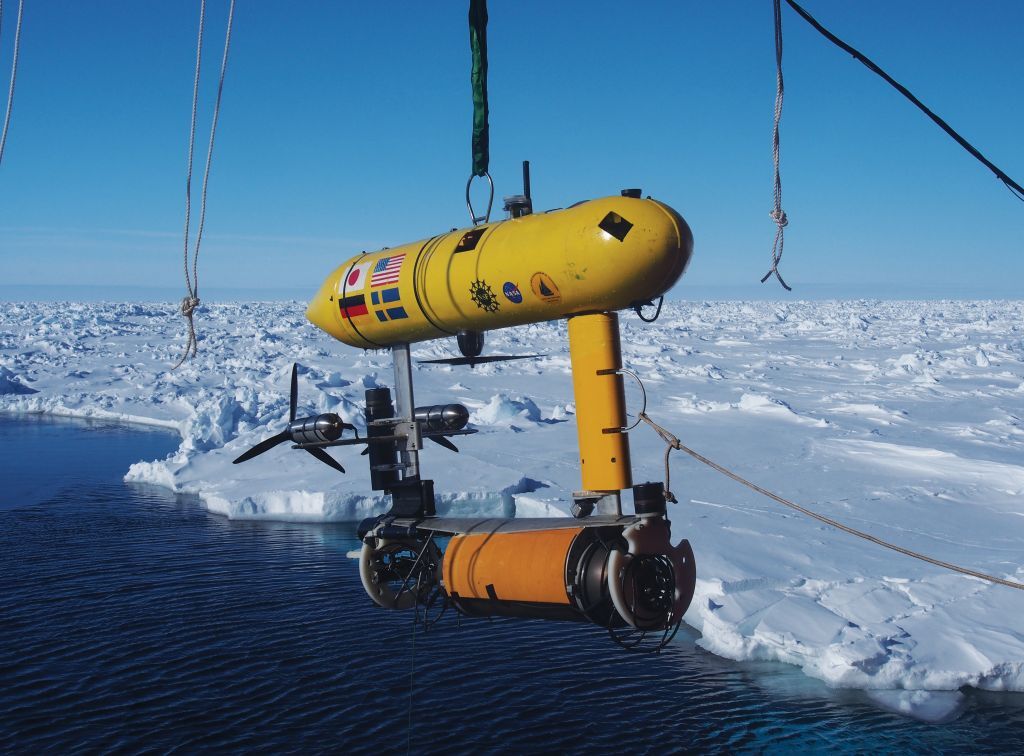
The 2-m (6 ft) long, 200 kg (440 lb) SeaBED autonomous underwater vehicle (AUV) swam 20-30 m (65-100 ft) below the ice to previously-inaccessible areas on two separate expeditions, first in 2010 and then again in 2012. It moved in a "lawnmower" grid pattern at a rate of around 30 cm/s (12 in/s) as it mapped the complex topography of the underside of the ice in 400 by 400 meter (1,312 by 1,312 ft) chunks, with multi-beam (and upward-pointing) sonar that was compiled and converted into 3D maps of the surface beneath the ice floes.
These maps reveal large variability in ice thickness, more akin to inverted mountain ranges than the undulating plains you might expect. The mean thickness ranged from 1.4 to 5.5 m (4.6-18 ft), with the thickest point measuring 16 meters (52.5 ft) and an average of 76 percent of the ice volume displaying deformity.
SeaBED was able to map the ice thickness at a resolution of better than 25 cm (10 in), which co-lead author Dr Guy Williams said enabled the research team "to discriminate individual ridge keels and rafted ice blocks." It wasn't easy to create the robot, though.
"Putting an AUV together to map the underside of sea ice is challenging from a software, navigation and acoustic communications standpoint," explained Hanumant Singh, an engineering scientist at the Woods Hole Oceanographic Institution whose lab designed, built, and operated the AUV. "SeaBED's maneuverability and stability made it ideal for this application where we were doing detailed floe-scale mapping and deploying, as well as recovering in close-packed ice conditions. It would have been tough to do many of the missions we did, especially under the conditions we encountered, with some of the larger [autonomous underwater] vehicles."
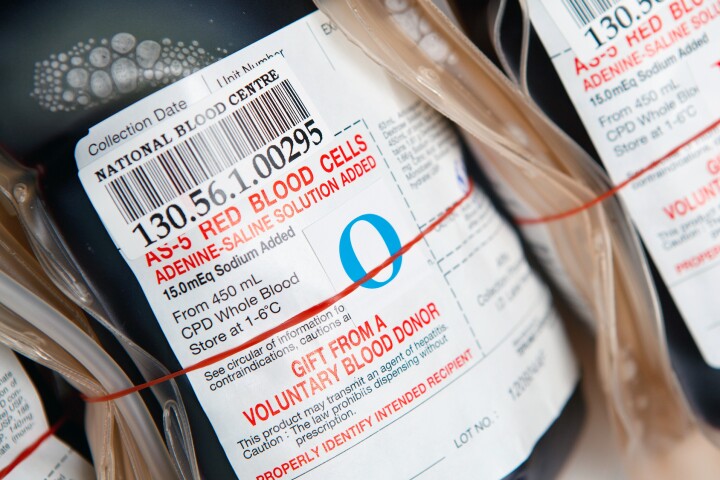
Sea ice thickness is normally measured using a "point-based" method of drilling hundreds of holes, which is a labor-intensive and season-dependent endeavor, or through estimates via satellite and nearby ships – both of which are complicated by snow cover on the ice. But Williams likens these old methods to diagnosing a patient by prodding their skin.

None provide anything like the detail or reliability of the SeaBED maps, which could now make it possible to look deeply at the differences between Arctic and Antarctic sea ice and to vastly improve our understanding of the mechanisms that drive climate patterns and marine life in the region.
The scientists will now do surveys on a larger scale. "The AUV missions have given us a real insight into the nature of Antarctic sea ice – like looking through a microscope," said co-author Jeremy Wilkinson. "We can now measure ice in far greater detail and we're excited to measure ice up to 17 meters thick."
You can watch a video below of Williams explaining how and why Antarctic sea ice is being mapped.
A paper describing the research was published in the journal Nature Geoscience.
Sources: National Science Foundation, Woods Hole Oceanographic Institution, Australian Antarctic Division