


A new study on The World Distribution of Household Wealth by the Helsinki-based World Institute for Development Economics Research of the United Nations University was launched earlier this week. The study shows the richest 2% of adults in the world own more than half of global household wealth.
The most comprehensive study of personal wealth ever undertaken also reports that the richest 1% of adults alone owned 40% of global assets in the year 2000, and that the richest 10% of adults accounted for 85% of the world total. In contrast, the bottom half of the world adult population owned barely 1% of global wealth. The research finds that assets of US$2,200 per adult placed a household in the top half of the world wealth distribution in the year 2000. To be among the richest 10% of adults in the world required US$61,000 in assets, and more than US$500,000 was needed to belong to the richest 1%, a group which — with 37 million members worldwide — is far from an exclusive club.
The UNU-WIDER study is the first of its kind to cover all countries in the world and all major components of household wealth, including financial assets and debts, land, buildings and other tangible property.
'One should be clear about what is meant by "wealth",' say co-authors James Davies of the University of Western Ontario, Anthony Shorrocks and Susanna Sandstrom of UNU-WIDER, and Edward Wolff of New York University. 'In everyday conversation the term "wealth" often signifies little more than "money income". On other occasions economists use "wealth" to refer to the value of all household resources, including human capabilities.'
'We use the term in its long-established sense of net worth: the value of physical and financial assets less debts. In this respect, wealth represents the ownership of capital. Although capital is only one part of personal resources, it is widely believed to have a disproportionate impact on household wellbeing and economic success, and more broadly on economic developmentand growth.'
Wealth levels across countries
Using currency exchange rates, global household wealth amounted to US$125 trillion in the year 2000, equivalent to roughly three times the value of total global production (GDP) or to US$20,500 per person. Adjusting for differences in the cost-of-living across nations raises the value of wealth to US$26,000 per capita when measured in terms of purchasing power parity dollars (PPP$).
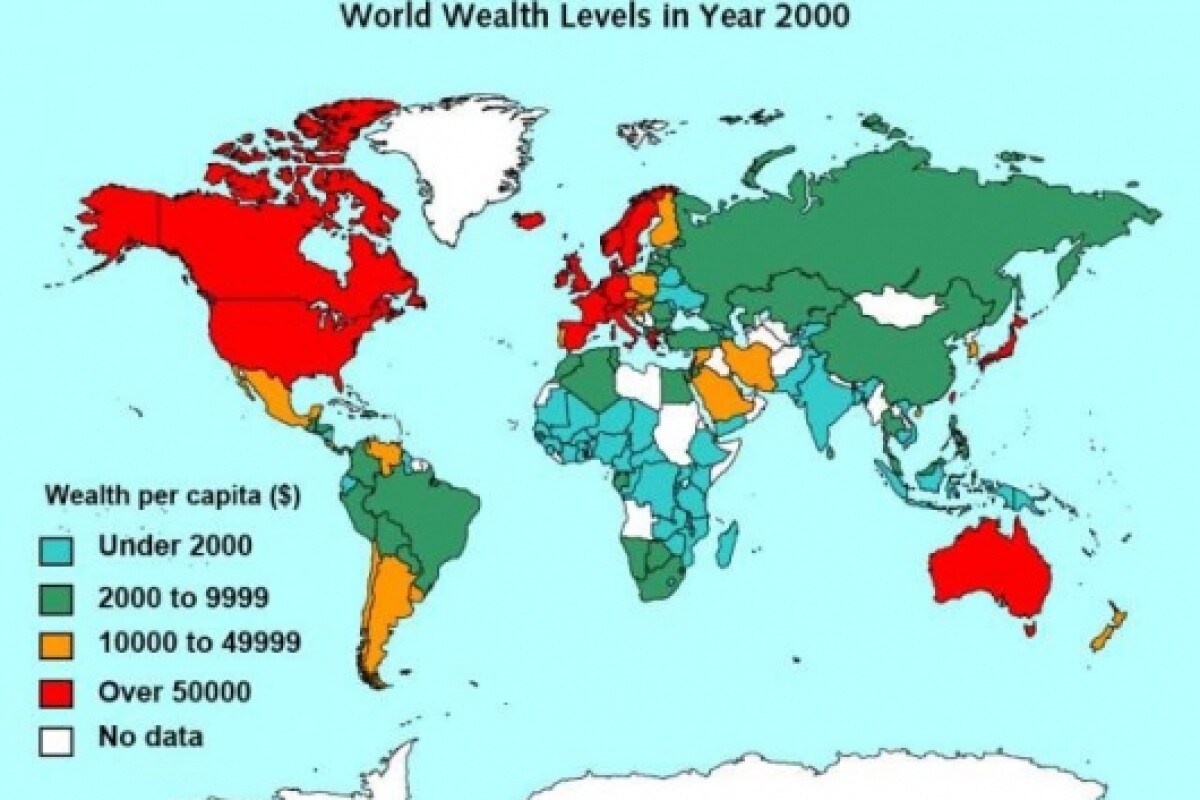
The world map shows per capita wealth of different countries. (Figure 1: World Wealth Levels in Year 2000) Average wealth amounted to $144,000 per person in the USA in year 2000, and $181,000 in Japan. Lower down among countries with wealth data are India, with per capita assets of $1,100, and Indonesia with $1,400 per capita.
Per capita wealth levels vary widely across countries. Even within the group of high-income OECD nations the range includes $37,000 for New Zealand and $70,000 for Denmark and $127,000 for the UK.
Wealth is heavily concentrated in North America, Europe, and high income Asia-Pacific countries. People in these countries collectively hold almost 90% of total world wealth. (Figure 2: Regional Wealth Shares) Although North America has only 6% of the world adult population, it accounts for 34% of household wealth. Europe and high income Asia-Pacific countries also own disproportionate amounts of wealth. In contrast, the overall share of wealth owned by people in Africa, China, India, and other lower income countries in Asia is considerably less than their population share, sometimes by a factor of more than ten. (Figure 3: Population and Wealth Shares by Region)
The study finds wealth to be more unequally distributed than income across countries. High income countries tend to have a bigger share of world wealth than of world GDP. The reverse is true of middle- and low-income nations. However, there are exceptions to this rule, for example the Nordic region and transition countries like the Czech Republic and Poland.
The authors of the UNU-WIDER study explain that in Eastern European countries 'private wealth is on the rise, but has still not reached very high levels. Assets like private pensions and life insurance are held by relatively few households. In the Nordic countries, the social security system provides generous public pensions that may depress wealth accumulation.'
World wealth inequality
The concentration of wealth within countries varies significantly but is generally high. The share of the top 10% ranges from around 40% in China to 70% in the United States, and higher still in other countries. The Gini value, which measures inequality on a scale from zero to one, gives numbers in the range from 35% to 45% for income inequality in most countries. In contrast, Gini values for wealth inequality are usually between 65% and 75%, and sometimes exceed 80%. Two high wealth economies, Japan and the United States, show very different patterns of wealth inequality, with Japan having a wealth Gini of 55% and the USA a wealth Gini of around 80%.
Wealth inequality for the world as a whole is higher still. The study estimates that the global wealth Gini for adults is 89%. The same degree of inequality would be obtained if one person in a group of ten takes 99% of the total pie and the other nine share the remaining 1%.
Where do the world's wealthy live?
According to the study, almost all of the world's richest individuals live in North America, Europe, and rich Asia-Pacific countries. Each of these groups of countries contribute about one third of the members of the world's wealthiest 10%. (Figure 4: Regional Composition of Global Wealth Distribution)
China occupies much of the middle third of the global wealth distribution, while India, Africa, and low-income Asian countries dominate the bottom third.
For all developing regions of the world, the share of population exceeds the share of global wealth, which in turn exceeds the share of members of the wealthiest groups. (Figure 3: Population and Wealth Shares by Region)
A small number of countries account for most of the wealthiest 10% in the world. One quarter are Americans and another 20% are Japanese. (Figure 5: Percentage Membership of Wealthiest 10%)
These two countries feature even more strongly among the richest 1% of individuals in the world, with 37% residing in the USA and 27% in Japan. (Figure 6: Percentage Membership of Wealthiest 1%)
According to Anthony Shorrocks, a country's representation in the rich person's club depends on three factors: the size of the population, average wealth, and wealth inequality.
'The USA and Japan stand out', he says, 'because they have large populations and high average wealth. Although Switzerland and Luxembourg have high average wealth, their populations are small. China on the other hand fails to feature strongly among the super-rich because average wealth is modest and wealth is evenly spread by international standards. However, China is already likely to have more wealthy residents than our data reveals for the year 2000, and membership of the super-rich seems set to rise fast in the next decade.'
Composition of household wealth
The UNU-WIDER study shows major international differences in the composition of assets, resulting from different influences on household behaviour such as market structure, regulation, and cultural preferences.
Real property, particularly land and farm assets, are more important in less developed countries. (Figure 7: Asset Composition in Selected Countries) This reflects not only the greater importance of agriculture, but also immature financial institutions.
The study also reveals striking differences in the types of financial assets owned. Savings accounts feature strongly in transition economies and in some rich Asian countries, while share-holdings and other types of financial assets are more evident in rich countries in the West. (Figure 8: Composition of Financial Wealth in Selected Countries)
According to the authors of the UNU-WIDER study, savings accounts tend to be favoured in Asian countries because 'there appears to be a strong preference for liquidity and a lack of confidence in financial markets. Other types of financial assets are more prominent in countries like the UK and USA which have well developed financial sectors and which rely heavily on private pensions.'
Surprisingly, household debt is relatively unimportant in poor countries. As the authors of the study point out: 'While many poor people in poor countries are in debt, their debts are relatively small in total. This is mainly due to the absence of financial institutions that allow households to incur large mortgage and consumer debts, as is increasingly the situation in rich countries'
The authors go on to note that 'many people in high-income countries have negative net worth and—somewhat paradoxically—are among the poorest people in the world in terms of household wealth.'
The World Institute for Development Economics Research of the United Nations University (UNU-WIDER) was established in 1985. The institute undertakes multidisciplinary research and policy analysis on structural changes affecting the living conditions of the world's poorest people; provides a forum for professional interaction and the advocacy of policies leading to robust, equitable, and environmentally sustainable growth; and promotes capacity strengthening and training for scholars and government officials in the field of economic and social policy making.